How Many Homes Have Solar Panels in the U.S.: 2023 Stats
Solar power is the fastest-growing clean energy source in the United States — in 2023, 50% of new added capacities to the U.S. power grid were solar.
Today, nearly 4% of single-family homes in the US generate electricity from solar panels, whereas a whopping 67% of non-solar households are interested in this technology.
So how much solar power do American households produce, which regions and states are the best for solar PV installation and what does the future of solar energy look like in the US?
Find out more.
Fascinating Residential Solar Power Stats and Facts
- The residential segment grew by 40% in 2022.
- 3.7% of single-family homes in the US are generating power from small-scale solar arrays.
- Solar PV installations accounted for 4.7% of electricity generation in the US.
- The residential solar market is set to increase by 7% this year.
- California accounts for 28.5% of total solar generation in the county.
- Homeowners can see a 14.6% rate of return on their solar investment.
- Solar deployment may exceed 100 GW per year by 2030.
How Much Solar Energy Do Homes Produce?
1. The residential segment installed 5.9 GWdc in 2022.
(SEIA)
This represents a staggering 40% increase, the highest annual growth on record since 2015. It is also the first year that the residential segment went over 5 GWdc of annual installations.
2022 was one of the most tumultuous years for the solar market in the United States, mainly due to import constraints. Therefore, this segment, which relies more on domestically-sourced modules, was less impacted by trade and import issues.
2. Small-scale solar energy production stood at 49 million megawatt hours.
(USAFacts)
Solar power generated through homes, businesses, and other small-scale facilities was an estimated 49 million megawatt hours in 2021, a four-time increase from the amount produced in 2014. This amount of electricity is enough to power almost 4.4 million homes nationwide.
On the other hand, utility-scale facilities (power plants with an installed capacity of at least one megawatt hour) generated 111,755 megawatt hours of solar energy in 2021.
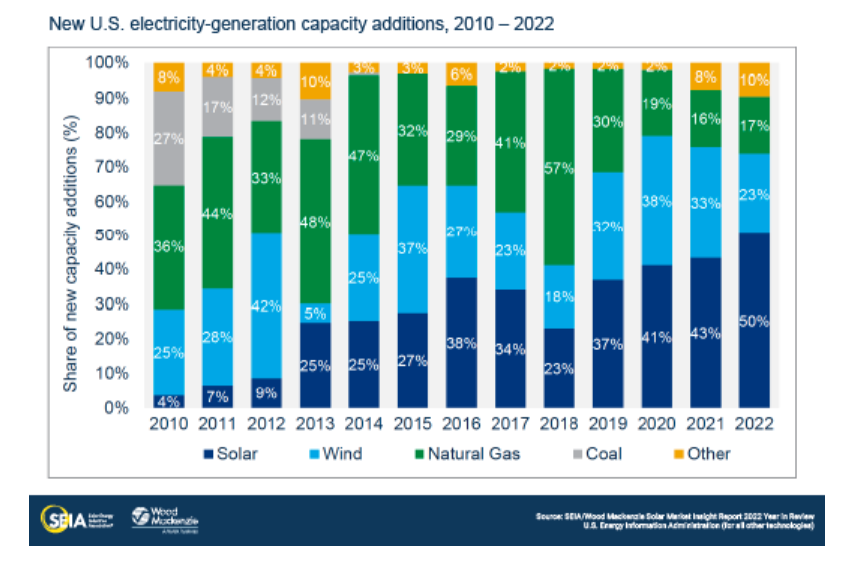
3. Solar accounted for half of new electricity-generating capacity added to the grid last year.
(SEIA)
Solar has been the top technology for new additions to the US power grid for four consecutive years between 2019 and 2022.
4. What percentage of U.S. electricity comes from solar?
(EIA, pv magazine)
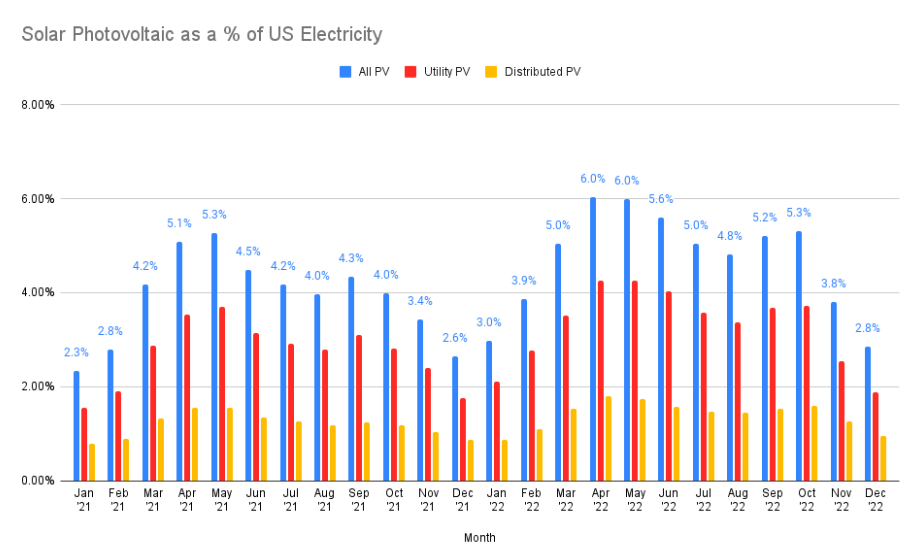
In 2022, solar PV installations accounted for 4.7% of electricity generation in the US. This marks a 21% increase since the previous year when solar took up 3.9% of US power generation. Solar’s contribution to total electricity generation was supposed to be 5% in 2022, however, due to import difficulties of solar panel elements and inflation, growth was slowed.
In terms of monthly production, solar generated the most electricity in April and May (6% of the total), while the lowest point was in December (2.8%).
What Percentage of U.S. Homes Have Solar Panels?
5. How many homes have rooftop solar installed?
(EIA)
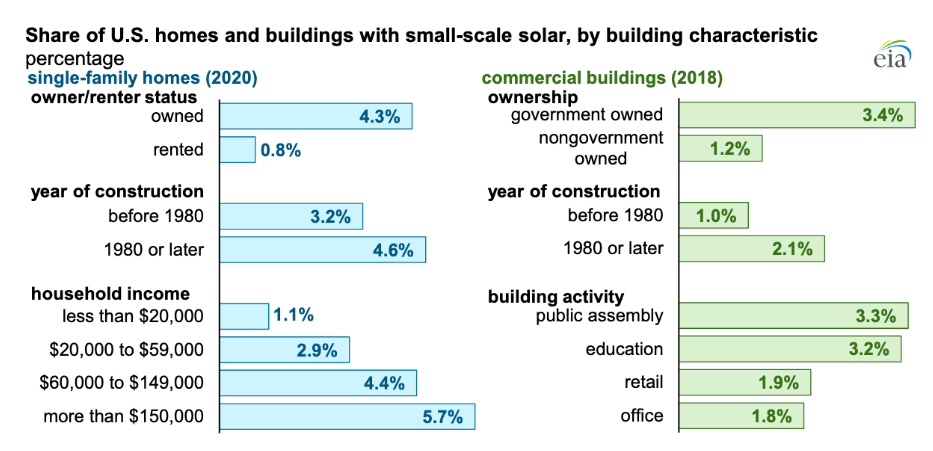
3.7% of single-family homes in the US were generating power from small-scale solar arrays in 2020. The installation of small-scale solar systems differed based on various factors. For instance, 4.6% of homes built after 1980 had solar panels installed compared to 3.2% of houses built before 1980.
Household income also played a role — households with an annual income over $150k were more likely to install solar panels (5.7%) as opposed to just 1.1% of homes with an annual income under $20,000.
6. 700,000 homeowners installed solar panels in 2022.
(SEIA)
By the end of the year, 6% of single-family owner-occupied homes had solar panels installed, up from 4.3% in 2020.
7. The US solar market installed 20.2 GWdc of capacity, solar energy statistics for 2023 show.
(SEIA)
This marks a 16% decrease compared to 2021. The decline is mainly caused by import issues, including the anticircumvention investigation (looking into imports of solar cells and modules from Cambodia, Malaysia, Thailand, and Vietnam) and the various detentions by Customs and Border Protection (CBP) of solar equipment.
8. 66.5% of homeowners who don’t have solar are interested in getting the technology.
According to a 2022 survey from Rocket Homes, over 90% of homeowners are interested in solar because they believe it will lower their electricity bills, while 84% think solar will provide a solid return on investment.
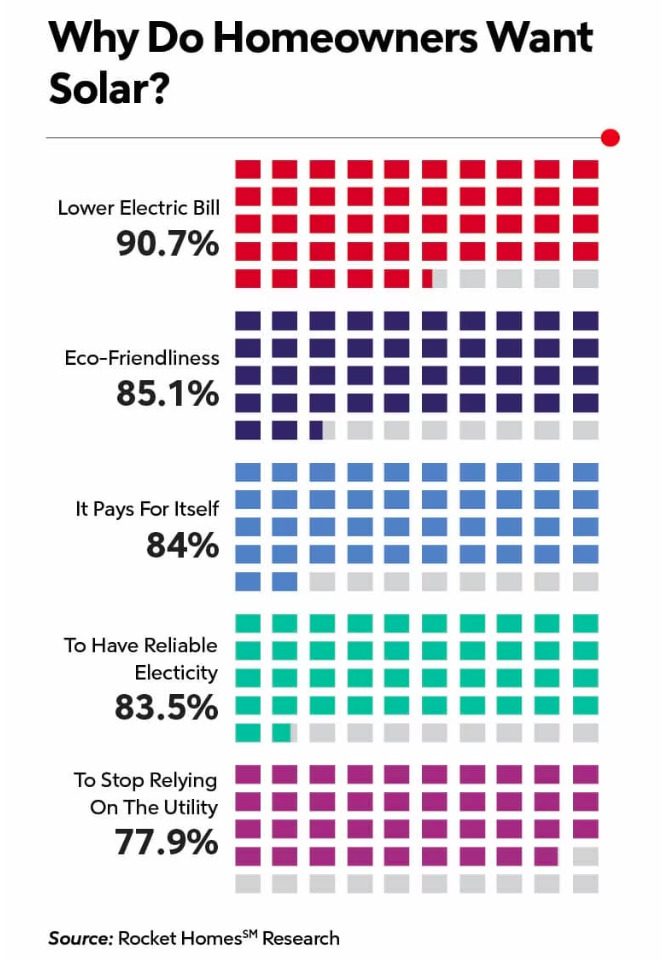
Homeowners also believe that solar panels increase the value of the home, with most saying that solar adds around $12,500 to the value of the house. They may be right as data shows that listings with solar power systems are 24.7% more likely to sell higher than the asking price. On top of that, these homes spend 13.3% less time on the market.
US Solar Market Growth Trends
9. The residential solar market is set to grow by 7% this year.
(SEIA)
The solar industry outlook is looking up in 2023 as the residential solar market is set to see steady growth mainly fueled by the Inflation Reduction Act (IRA). In fact, it is forecast that the segment will quadruple by 2033, adding 95 GWdc of installed capacity by the end of the forecast period.
10. Installations in 2023 should increase by 41%.
(SEIA)
2022 was one of the most volatile years in terms of solar policy in the United States both due to supply chain disruptions and the passing of the IRA. Assuming no further issues impact import and policies, installations in 2023 should increase to 28.4 GWdc or a 41% increase from 2022, the U.S. Solar Market Insights report confirms.
11. Total installed solar is projected to be five times bigger in 2033 compared to 2022.
(SEIA)
In the long term, cumulative solar installations should go up to 700 GWdc or five times higher than the 141 GWdc installed by the end of 2022. A 19% growth is expected by 2027, while the growth rate should slow to 7% annually up to 2033.
Solar Energy Production and Usage by State in the USA
12. What states use solar energy the most?
(EIA)
The West has the highest share of homes with solar panels. Actually, 8.9% of single-family homes in Western states generate electricity from solar energy, while the Northeast Census Region had the second-largest percentage in 2020 (4.7%) ahead of the South (1.7%) and the Midwest (1.4%).
In addition to favorable weather conditions, the two highest-ranked regions also had policies and incentives that have encouraged the adoption of solar systems.
13. With around 300 sunny days, Arizona has the biggest potential for solar.
(World Population Review, Forbes)
When it comes to solar potential by state, Arizona takes the lead with solar radiation of 5,755 kJ per square meter of average annual sunlight. New Mexico is ranked second (5,642 kJ/m2), followed by Nevada (5,296 kJ/m2), Texas (5,137 kJ/m2), and California (5,050 kJ/m2).
Despite its huge potential, solar power is still underutilized in many states. For instance, Kansas has 128 sunny days but produces only 0.2% of the state’s energy needs through solar and has just 110 MW of capacity installed.
14. Solar energy generation by state.
California accounts for 28.5% of total solar generation in the county and had a total installed capacity of 3,937 MW as of February 2023, ranking number one among the states.
Texas is ranked second (1,541 MW of capacity) taking up an 11.2% share of US total generation, followed by Florida (9.2%), Arizona (5.5%), and North Carolina (5.2%).
In terms of how much of the state’s power came from solar, California is again at number one, supplying 25.8% of energy generation in the state from solar power. Nevada is next (22.5%), then Hawaii (19.2%), Massachusetts (18.3%), Vermont (14.2%), and Rhode Island (11.3%).
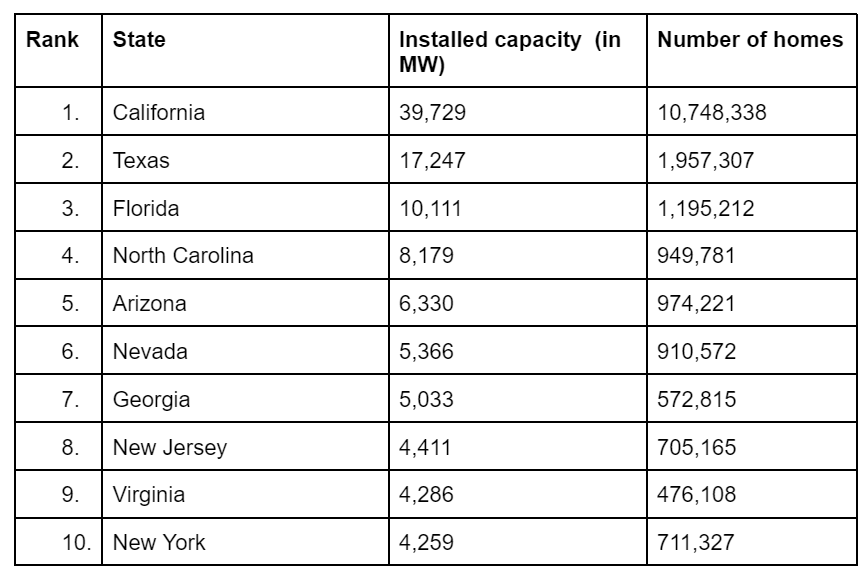
15. Top U.S. states in solar PV capacity 2022.
(SEIA)
With more than 39 GW, i.e. the capacity to power 10,748,338 homes, the Golden State has the biggest capacity of solar power in the country ahead of Texas (17 GW), Florida (10 GW), North Carolina (about 8 GW), and Arizona (around 6 GW).
Here is a breakdown of the PV capacity of the top ten states and the number of homes that can be supplied by solar energy.
16. How many homes have solar panels in California?
There are 10,510,648 homes in the Golden State that are currently powered by solar energy. California also has around 150 sunny days a year and a robust job market (75,712 solar jobs) making this one of the best states for solar.
Annual residential solar installations in California increased to more than 2 GWdc compared to 2020, but recent changes to the market (such as the implementation of NEM 3.0 which means solar systems will earn approximately 75% less for the excess electricity they sell back to the grid) are expected to cut the market by 38% by 2024, which will cause a 3% drop in the number of installations across the country.
When it comes to the best and worst states for solar energy in 2023, North Dakota is on the other end of the spectrum. There are only 2 MW of solar installations in the state, powering just 149 homes. The state’s contribution to total energy generation is negligible (0%) and the job market (with only 262 jobs available) is not as robust.
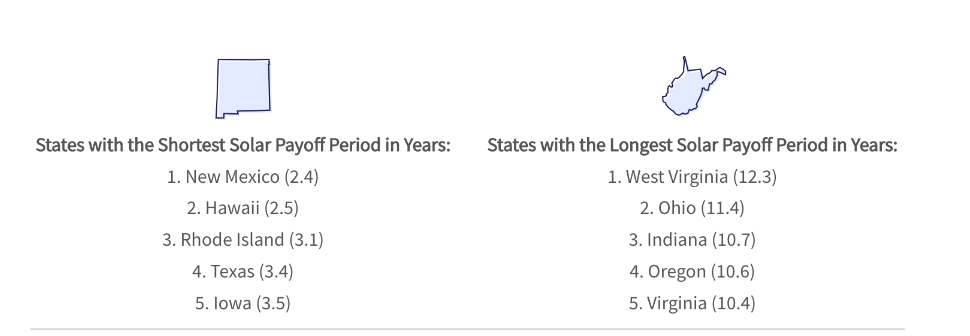
17. States with the highest ROI from solar.
With a 51.4% return on upfront costs, New Mexico offers the most significant return on investment. Hawaii (48.3% rate of return) comes second, while Rhode Island (37.3%), Texas (33.7%), and Iowa (32.2%) round off the top five.
These states also have the shortest payoff period, i.e. how long it takes for the solar panel installation to pay for itself.
On the other hand, states like Wisconsin (5% of costs saved), Utah (6%), Vermont (6%), Florida (6%), and New Jersey (7%) offer some of the lowest incentives for homeowners.
18. 5 states where solar is illegal.
Although solar is not illegal anywhere in the US, some states impose certain restrictions on homeowners. For instance, when looking at solar regulations by state, South, and North Dakota are at the bottom of the list primarily due to a lack of incentives. Neither state has a Solar Renewable Energy Certificate (SREC) program or a Renewable Portfolio Standard (RPS) that provides a structure for creating renewable bills and incentives.
Kansas and Oklahoma, both of which have a relatively high number of sunny days, are also ranked pretty low. In both states, the RPS is voluntary so utility companies do not have to comply with it. On top of that, Kansas has a net metering program that offers wholesale rates of 2.1 cents per kilowatt (as opposed to the 11.3 cents per kilowatt offered at retail price).
Similarly, Nebraska makes it hard for homeowners to make money off their solar panels. Under the net metering system in the state, the electricity generated by residential solar systems is worth less than the retail value.
U.S. Solar PV Pricing Trends & Deployment Growth
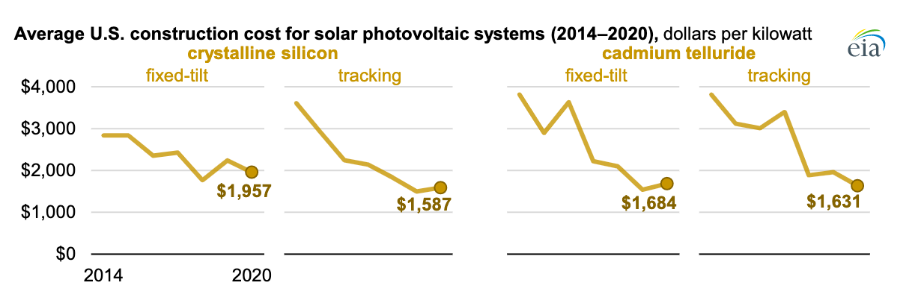
19. Average construction costs for solar PV systems declined by 8% in 2020.
(EIA)
In 2020, the construction costs for all solar panel types dropped 8% to an average of $1,655 per kilowatt. The decline is due to a drop in the construction cost of cadmium telluride tracking panels, which went down by 17% to $1,631 per kW, the lowest on record since 2014, and the decline in the construction cost of crystalline silicon fixed-tilt panels by 13%.
The majority of solar panels in the US (61% of the utility-scale solar capacity added to the power grid) are crystalline silicon tracking systems. The construction cost for these solar systems increased by 6% in 2020, going up to $1,587 per kW.
20. System pricing increased by 7% in Q4 2022 for the residential segment.
(SEIA)
Compared to the same quarter in 2021, the price of residential solar systems went up from $3.07 to $3.30.
Overall, though, the cost to install solar systems reduced by over 70% over the last decade.
21. Solar deployment may exceed 100 GW per year by 2030.
According to a study by Princeton University, solar deployment may increase from the 10 GW of capacity added a year to almost five times more by 2024. This means that an average of 49 GW of utility-scale solar capacity will be added each year, largely fueled by the implementation of the Inflation Reduction Act.